
The great challenge of the 21st century: How do we organise a society that is both sustainable and affordable?
To understand the origin of this problem, please read this first.
Looking for a 1 page summary? Download Affordable Social Democracy.
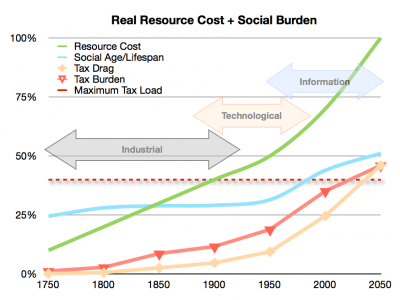
The chart below presents the factors contributing to the challenge, see below for detailed explanations.

What this shows is that the tax burden on the economy will inevitably exceed is maximal percentage as our population ages, unless the percentage of total activity in the society that is monetised is reduced.
In short: some services have to be exchanged for free, otherwise you go broke trying.
Blue line: Social Age/Lifespan
As human society passes through the 3 revolutions (Industrial, Technological and Information) it levels off and reaches a more stable balance of young and old in proportion to working age adults.
At the end the percentage of able and working age is a minority.
Green line: Resource Cost
This represents the percentage of the true cost of a resource that is reflected in it’s economic price. As human societies across the world all start their progression through the revolutions, and as the “externalities” of resource use manifest, the greater the percentage of the true cost of a resource gets incorporated in it’s economic price. Low values represent high exploitation.
This line could even go above 100% in the near future, as we have to recoup expenses related to previously unpaid-for externalities that come home to roost, such as climate change mitigation costs.
Red line: Tax Burden
The Tax Burden represents the monetary cost to the economy of meeting the social needs of the society. This increases with 2 factors:
- Social lifespan – the percentage of a life spent maturing and ageing
- Monetary Penetration – the extent to which total activity in the society is monetised, specifically the attribution of monetary values to services
Orange line: Tax Drag
This line compensates the tax effect on the economy by the extent to which true costs are incorporated in resource prices. While resources are available at below true cost (exploitation), the economy does not have to work as hard to generate the wealth to cover the tax burden. As the Resource Cost increases, the economy has to work harder to produce the same amount of wealth.

Most factors are outside our control, demographic changes and resource cost increases are basically fixed, the only factor within our control that can make a difference is monetary penetration (the percentage of total activity that is paid for with money). If as much activity as possible is pushed into the wealth economy and exchanged for money, the correlated tax burden on the wealth economy has to exceed it’s optimal maximum of around 40%.
On the other hand, if monetary penetration is kept below 80% in a society with 50%+ dependency, then tax rates can be restrained to the 40% maximum. Even better would be to push monetary penetration down to 70%, at which point the tax burden is under 36%.
See table: There is a direct relationship between dependency ratios and tax rates. In this table blue=capitalist, green/yellow=social, red=communist. Pick your tax rate and you can see which social system you need to have to make that tax rate possible.
If you live in a society with 50%+ dependency, the key is to have at least one fifth of all activity in “not paid for in cash”. Ever since the industrial revolution we have pushed to have more and more activity “monetised” (paid for with money), and therefore part of the society’s GDP, measured in money. That works fine while the majority of all activity is productive, (i.e. you don’t have a lot of old and young people) because taxes are a proportion of the money economy, and when the money economy is growing tax revenues rise faster than the increased expense caused by having more activity monetised. However once the majority of the population is dependent (i.e. lots of old and young people), having more activity monetised increases expenses more than it increases tax revenues.
The way to push monetary penetration down is to deliver social security as free, non-means-tested, universal services. This works to socialise the most basic portion of labour cost, because it is exchanged in an unconscious barter for the value of the services.
Data Table
|
Notes |
1750 |
1800 |
1850 |
1900 |
1950 |
2000 |
2050 |
|
|
Social Activity (Barter) |
% of total activity that is exchanged without cash |
95% |
90% |
70% |
60% |
40% |
20% |
10% |
|
Commercial Activity (Paid) |
% of total activity that is paid for in cash/credit |
5% |
10% |
30% |
40% |
60% |
80% |
90% |
|
Avg Lifespan |
45 |
46 |
47 |
47 |
70 |
82 |
90 |
|
|
Productive Start Age |
12 |
14 |
15 |
16 |
17 |
20 |
23 |
|
|
Productive End Age |
45 |
46 |
47 |
47 |
65 |
66 |
67 |
|
|
Working Age/Life |
73% |
70% |
68% |
66% |
69% |
56% |
49% |
|
|
Social Age/Lifespan |
27% |
30% |
32% |
34% |
31% |
44% |
51% |
|
|
Resource Cost |
Actual cost relative to true/free cost |
10% |
20% |
30% |
40% |
50% |
70% |
100% |
|
Labour Production Effort |
Working lifespan contribution factored by actual cost |
733% |
348% |
227% |
165% |
137% |
80% |
49% |
|
Economy Size (UK) |
BoE Real GDP UK (1850+) |
100 |
225 |
548 |
1,854 |
13,308 |
976,533 |
2,000,000 |
|
Underlying Economy (Real Effort) |
Real economic effort, as if resources were true cost |
10 |
45 |
164 |
742 |
6,654 |
683,573 |
2,000,000 |
|
Social Cost |
Cost of providing for social lifespan on underlying economy factoring % of activity that is paid for |
0 |
1 |
16 |
101 |
1,255 |
240,084 |
920,000 |
|
Tax Drag |
Tax rates factored by Resource Cost |
0.13% |
0.61% |
2.87% |
5.45% |
9.43% |
24.59% |
46.00% |
|
Social Cost II |
Cost of providing for social lifespan at actual resource cost factoring % of activity that is paid for |
1 |
7 |
52 |
252 |
2,510 |
342,977 |
920,000 |
|
Tax Burden |
Nominal tax rates for social costs |
1.33% |
3.04% |
9.57% |
13.62% |
18.86% |
35.12% |
46.00% |
Maximum Tax Burdens
There is a fair amount of research on the issue of the maximum tax burden that an economy can sustain before the effect becomes negative on the performance of the economy. To make a determination on a simpler basis, we can just look at the current tax rates for various countries around the world.
- Top 10 Highest Tax Countries (includes all the Scandavian): average 45%
- Top 50 Highest Tax Countries: average 37%
Economically Active Ages


5 replies on “Understanding Affordable Social Democracy”
The “great resource squeeze” is already in effect, see http://www.imf.org/external/np/res/commod/Charts.pdf
LikeLike
On understanding “monetary penetration”: Market economy v Market society – Michael Sandel on the penetration of markets into social spheres: http://www.youtube.com/watch?v=GvDpYHyBlgc
LikeLike
[…] limit to the tax burden (~40%) compatible with our evolutionary […]
LikeLike
[…] for CI. The cost of the services that we all assume to pre-exist a CI is roughly equal to the maximum tax burden an economy can sustainably support, in both cases ~40% […]
LikeLike
For lecture at UCL on this topic: https://youtu.be/myL2H3mMgu0
LikeLike